Artificial Intelligence is the future and all the tech giants already know that. They don’t want to work on the advancement of this technology alone, and thus releases useful resources and powerful tools, time to time, to help small organizations and individual developers do their share of the job.
With that being said, a few days ago, Microsoft announced TensorWatch which is an open-source debugging and visualization tool aims to help deep learning and data, science enthusiasts.
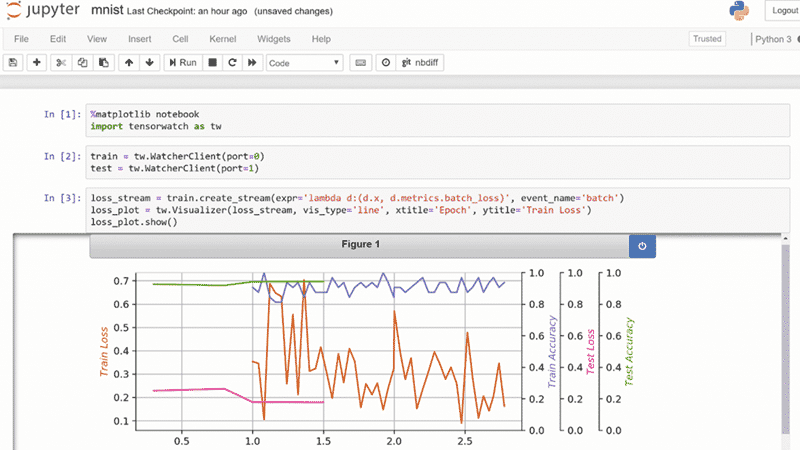
TensorWatch is based on the Jupyter Notebook and can perform several key analysis tasks for AI models and data. It shows a real-time visualization of machine learning training. It can execute random queries during the live ML training process and return a stream as a result of the query. You can view this stream using the visualizer.
TensorWatch is flexible, extensible and allows users to build their own custom visualizations, UIs, and dashboards. As of now, it’s under development but the company is aiming to provide an easy to use platform debugging machine learning in a hackable package.
According to Shital Shah, Principal Research Engineer at Microsoft Research AI, “We like to think of TensorWatch as the Swiss Army knife of debugging tools with many advanced capabilities researchers and engineers will find helpful in their work. We presented TensorWatch at the 2019 ACM SIGCHI Symposium on Engineering Interactive Computing Systems.”
Also Read: Microsoft Unveiled Ideas: A New AI Writing Tool For Microsoft Word
Contents
Some Major Features of TensorWatch

Lazy Logging Mode
TensorWatch introduces lazy logging mode that doesn’t require explicit logging of all the information.
It helps users to recognize and track variables including large models or whole batches during the training. Furthermore, you can perform interactive queries to run in the context of these variables which further returns the streams as a result.
Streams
In TensorWatch, the data and objects such as console, sockets, cloud storage, files, and even visualizations are considered as streams. These streams can listen to other streams and leads to the creation of custom data flow graphs.
Easy Customization and Visualizations
Jupyter Notebook provides easy customization options. You can debug the real-time training processes interactively either using a composable UI or live shareable dashboards in Jupyter Lab.
As TensorWatch is a Python library, users can build their own custom UIs or use it with many other tasks in the broad Python data science ecosystem. It supports histograms, bar charts, pie charts, 3D variations, and many other standard visualization types.
Recommended: Top 3 Major Limitations of Artificial Intelligence (AI)
“For example, you can write a lambda expression that computes mean weight gradients in each layer in the model at the completion of each batch and sends the result as a stream of tensors that can be plotted as a bar chart,” Shah wrote in the blog post.
Lastly, talking about users’ reactions, they seem quite excited as TensorWatch help them visualize streams of data in real-time.

